
Summary
- The European Commission is preparing a rating scheme using data reported by facilities with at least 500kW of installed IT demand.
- Draft A–G classes for PUE and WUE simplify comparison, although climate, water stress, occupancy, and facility boundaries can materially affect the underlying ratios.
- Illustrative modelling shows how one data centre can perform strongly on one efficiency measure and poorly on another without either measurement being incorrect.
On 28 July, the European Commission updated the guidance supporting its database for the energy performance and water footprint of data centres. Operators of facilities with at least 500kW of installed IT power demand already report information under the Energy Efficiency Directive framework, while the Commission is preparing a wider Data Centre Energy Efficiency Package that will assess those submissions, introduce a common rating scheme, and support later work on minimum performance standards.
Across much of Europe, water availability has provided a reminder of how local conditions complicate apparently simple efficiency comparisons. On 12 August, the Commission’s Joint Research Centre reported worsening drought across several regions, with the Loire, Po, Rhine, and Danube reaching record low levels in August. Its latest data showed 50% of the EU and UK under some level of drought condition in late July.
A low Power Usage Effectiveness figure can describe an efficient relationship between IT energy and total facility energy, but it cannot establish whether a cooling system is making sensible use of local water resources. A low Water Usage Effectiveness figure can show that little water is being consumed directly at the site without showing how much additional electricity may be needed to achieve that result.
Europe’s regulatory work is relying on metrics that describe different parts of facility performance while trying to make those measurements sufficiently consistent to support comparison across data centres operating under different physical conditions.
Under the Commission’s draft rating scheme, PUE and WUE would each receive an A–G classification. PUE receives an A at 1.15 or below and a G above 1.90, while WUE receives an A at 0.10 litres per kWh of IT energy or below and a G above 1.00. Intermediate values fall into bands between those thresholds.
PUE compares total data centre energy consumption with the energy consumed by IT equipment. WUE relates direct water consumption to IT energy. Both ratios can provide useful operating information, although neither captures the full environmental performance of a facility.
Comparison begins with the inputs
Before an A–G scale can distinguish strong and weak performance, the data underneath it has to be sufficiently complete and consistent.
Uptime Institute examined the Netherlands’ 2025 Energy Efficiency Directive submissions, covering 2024 operating data from 104 facilities. It found that 27% of those facilities, representing 48% of the total data centre floor area in the Dutch dataset, had not provided both total energy and IT energy figures needed to calculate PUE and WUE.
The analysis covers the Netherlands rather than the whole EU and cannot be used to estimate reporting completeness across every member state. It nevertheless shows how large gaps can exist even within a national dataset gathered under a common framework.
European rules already account for some of the practical difficulty of collecting comparable information from colocation facilities. Where operators cannot obtain every required figure from customers, reporting arrangements contain transitional provisions for missing customer level information, while anonymised internal mechanisms can be used to gather relevant data from colocation tenants.
Mixed use buildings create further complications where cooling, electrical, or water infrastructure serves both the data centre and other spaces. Metering and allocation methods then determine how much consumption is attributed to the facility.
Common formulas remove one source of inconsistency, but they do not automatically make every measurement boundary identical. Facility definition, metering coverage, customer information, commissioning stage, and IT utilisation can all affect the quantities entering the calculation.
Once those quantities are converted into A–G classes, continuous differences in operation become categorical distinctions.
How four facilities can score very differently
Four simplified examples show how the draft ratings can respond to different operating profiles. The figures are illustrative rather than benchmarks and do not represent named facilities.
| Illustrative facility | Average IT load | PUE / class | Annual facility electricity | WUE / class | Annual direct water use | Relevant operating context |
|---|---|---|---|---|---|---|
| Evaporative assisted campus | 10MW | 1.18 / B | 103.4GWh | 0.70 / E | 61.3m litres | Lower cooling electricity at the cost of higher direct water use. |
| Dry cooled campus | 10MW | 1.32 / C | 115.6GWh | 0.05 / A | 4.4m litres | Very low direct water use with higher cooling electricity. |
| Liquid cooled site exporting heat | 10MW | 1.25 / B | 109.5GWh | 0.10 / A | 8.8m litres | Heat reuse depends on actual offtake and any additional pumping or heat raising energy. |
| Newly commissioned 10MW colo at 40% average IT load | 4MW | 1.55 / E | 54.3GWh | 0.15 / B | 5.3m litres | Fixed plant overhead is spread across a relatively small IT load. |
Illustrative model. Annual figures assume the stated average IT load is maintained for 8,760 hours. PUE and WUE values are hypothetical; efficiency classes apply the European Commission’s draft bands. The scenarios test the behaviour of the metrics and are not benchmarks for particular cooling technologies.
The evaporative assisted site receives a B for PUE and an E for WUE, while the dry cooled site receives a C for PUE and an A for WUE. Each result follows directly from the metric being used.
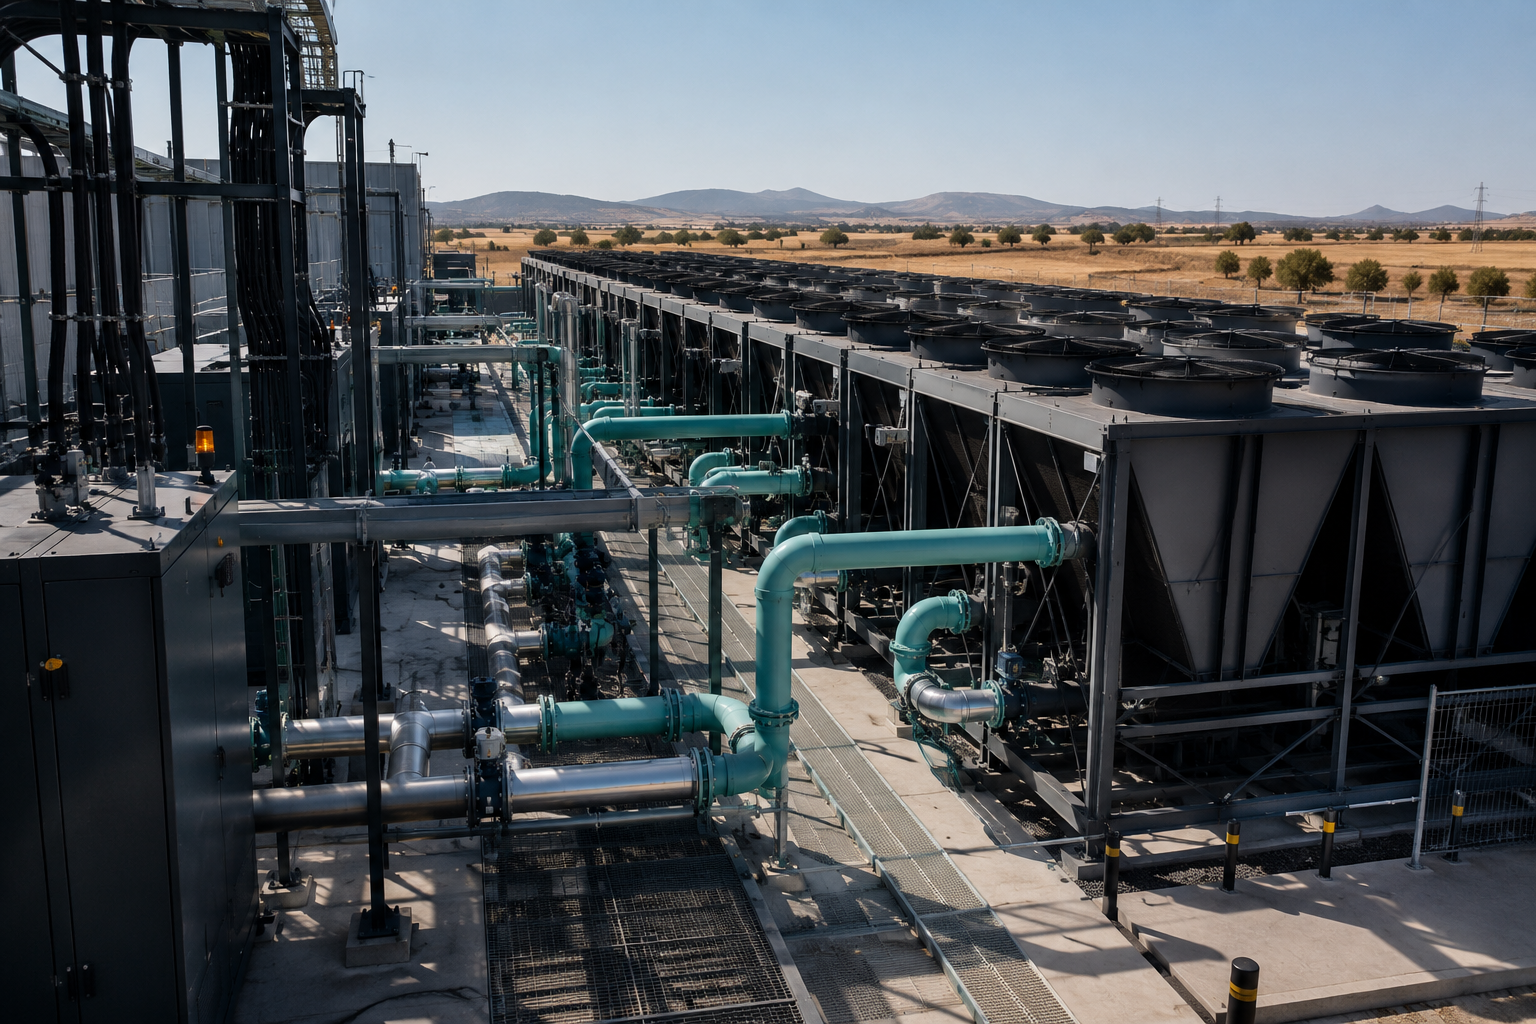
Evaporative cooling can reduce the electrical work needed to reject heat while increasing direct water consumption. Dry cooling can reduce water use substantially, although fans, compressors, or other mechanical systems may require more electrical energy under warmer ambient conditions.
Local resource availability does not appear directly in either raw ratio. A litre of water consumed in a stressed catchment is recorded in the same unit as a litre consumed where supply is abundant, while the additional electricity associated with a low water cooling system is reflected in PUE without indicating the regional carbon or water characteristics of the grid supplying it.
The European Data Centre Association has argued in its response to the draft scheme that PUE classifications should account for climate and that WUE should incorporate local water depletion. It has also called for clearer distinctions between design, ramp up, and normal operation. Those proposals reflect the operator industry’s position and would introduce their own methodological choices, although the underlying variables can materially alter the ratios used in the proposed rating system.
Occupancy provides one of the clearest examples. A newly commissioned building may run modern electrical and cooling plant but record a weak PUE while its halls remain only partly occupied, because a significant amount of fixed facility consumption is being divided by a relatively small IT load.
As occupancy rises, IT consumption increases and that fixed overhead becomes smaller relative to the denominator. The facility’s PUE can improve even when the underlying plant has not been replaced.
In the illustrative table, the 10MW colocation site running at an average 4MW IT load records a PUE of 1.55, placing it in class E. That figure accurately describes the assumed operating ratio during the period measured, but it does not establish how the same building would perform once customer load approaches its intended operating level.
Classification boundaries create another issue. Under the draft bands, a PUE of 1.25 falls into class B while 1.26 falls into class C. At a constant 10MW average IT load, a difference of 0.01 in PUE represents about 876MWh of annual facility electricity. At 50MW, the same difference represents roughly 4,380MWh.
Those are material quantities of energy, yet the physical change remains continuous while the rating changes category at a fixed threshold. Any banded rating system requires such boundaries, so their treatment becomes more consequential if procurement rules, planning decisions, financing criteria, or minimum standards begin referring to the resulting class.
Several objectives, separate measurements
Heat reuse introduces another variable that sits partly outside both PUE and WUE. A facility can perform strongly on energy and water ratios while recovering little useful heat, while another can use additional pumping or heat pump energy to deliver heat at a temperature suitable for a district network.
The amount of heat technically available is also different from the amount that can be used. A viable connection depends on nearby demand, network infrastructure, temperature requirements, operating hours, and investment outside the data centre itself.
The Commission’s wider reporting framework already includes renewable energy and waste heat reuse alongside PUE and WUE, avoiding reliance on a single universal score. Its minimum performance standards study is now using the first two Energy Efficiency Directive reporting cycles alongside technical evidence and stakeholder consultation to support later regulation.
Incomplete data needs to be distinguished from poor efficiency. A building filling its first halls needs to be distinguishable from a mature site carrying a similar PUE after years of operation. Water use in a stressed basin may require different context from the same volume in a region with abundant supply, while climate adjustments should not remove incentives to improve inefficient plant. Heat reuse figures need to distinguish useful delivery from theoretical availability.
PUE can continue to describe the relationship between IT energy and total facility energy, while WUE can expose direct water demand and heat reuse metrics can show another part of the resource picture. Problems arise when one of those measurements is treated as a complete proxy for performance outside the boundary it was designed to measure.
The Commission is building its rating system from a dataset that is still expanding and improving, while minimum performance standards remain under development. As those measurements carry greater regulatory and commercial weight, the quality of the comparison will depend on how well the framework separates genuine inefficiency from differences created by climate, utilisation, cooling architecture, metering boundaries, and access to surrounding infrastructure.
A simple grade can make performance easier to communicate. It cannot remove the engineering conditions that produced it.

