
Summary
- A Linköping University-led team analysed more than 2.6 million readings collected from 29 measurement points in 2021.
- Server operation and process cooling used 2,135MWh and 2,154MWh respectively in the reported annual energy allocation.
- Findings concern one water-cooled Ericsson room and cannot be generalised as an industry-wide consumption split.
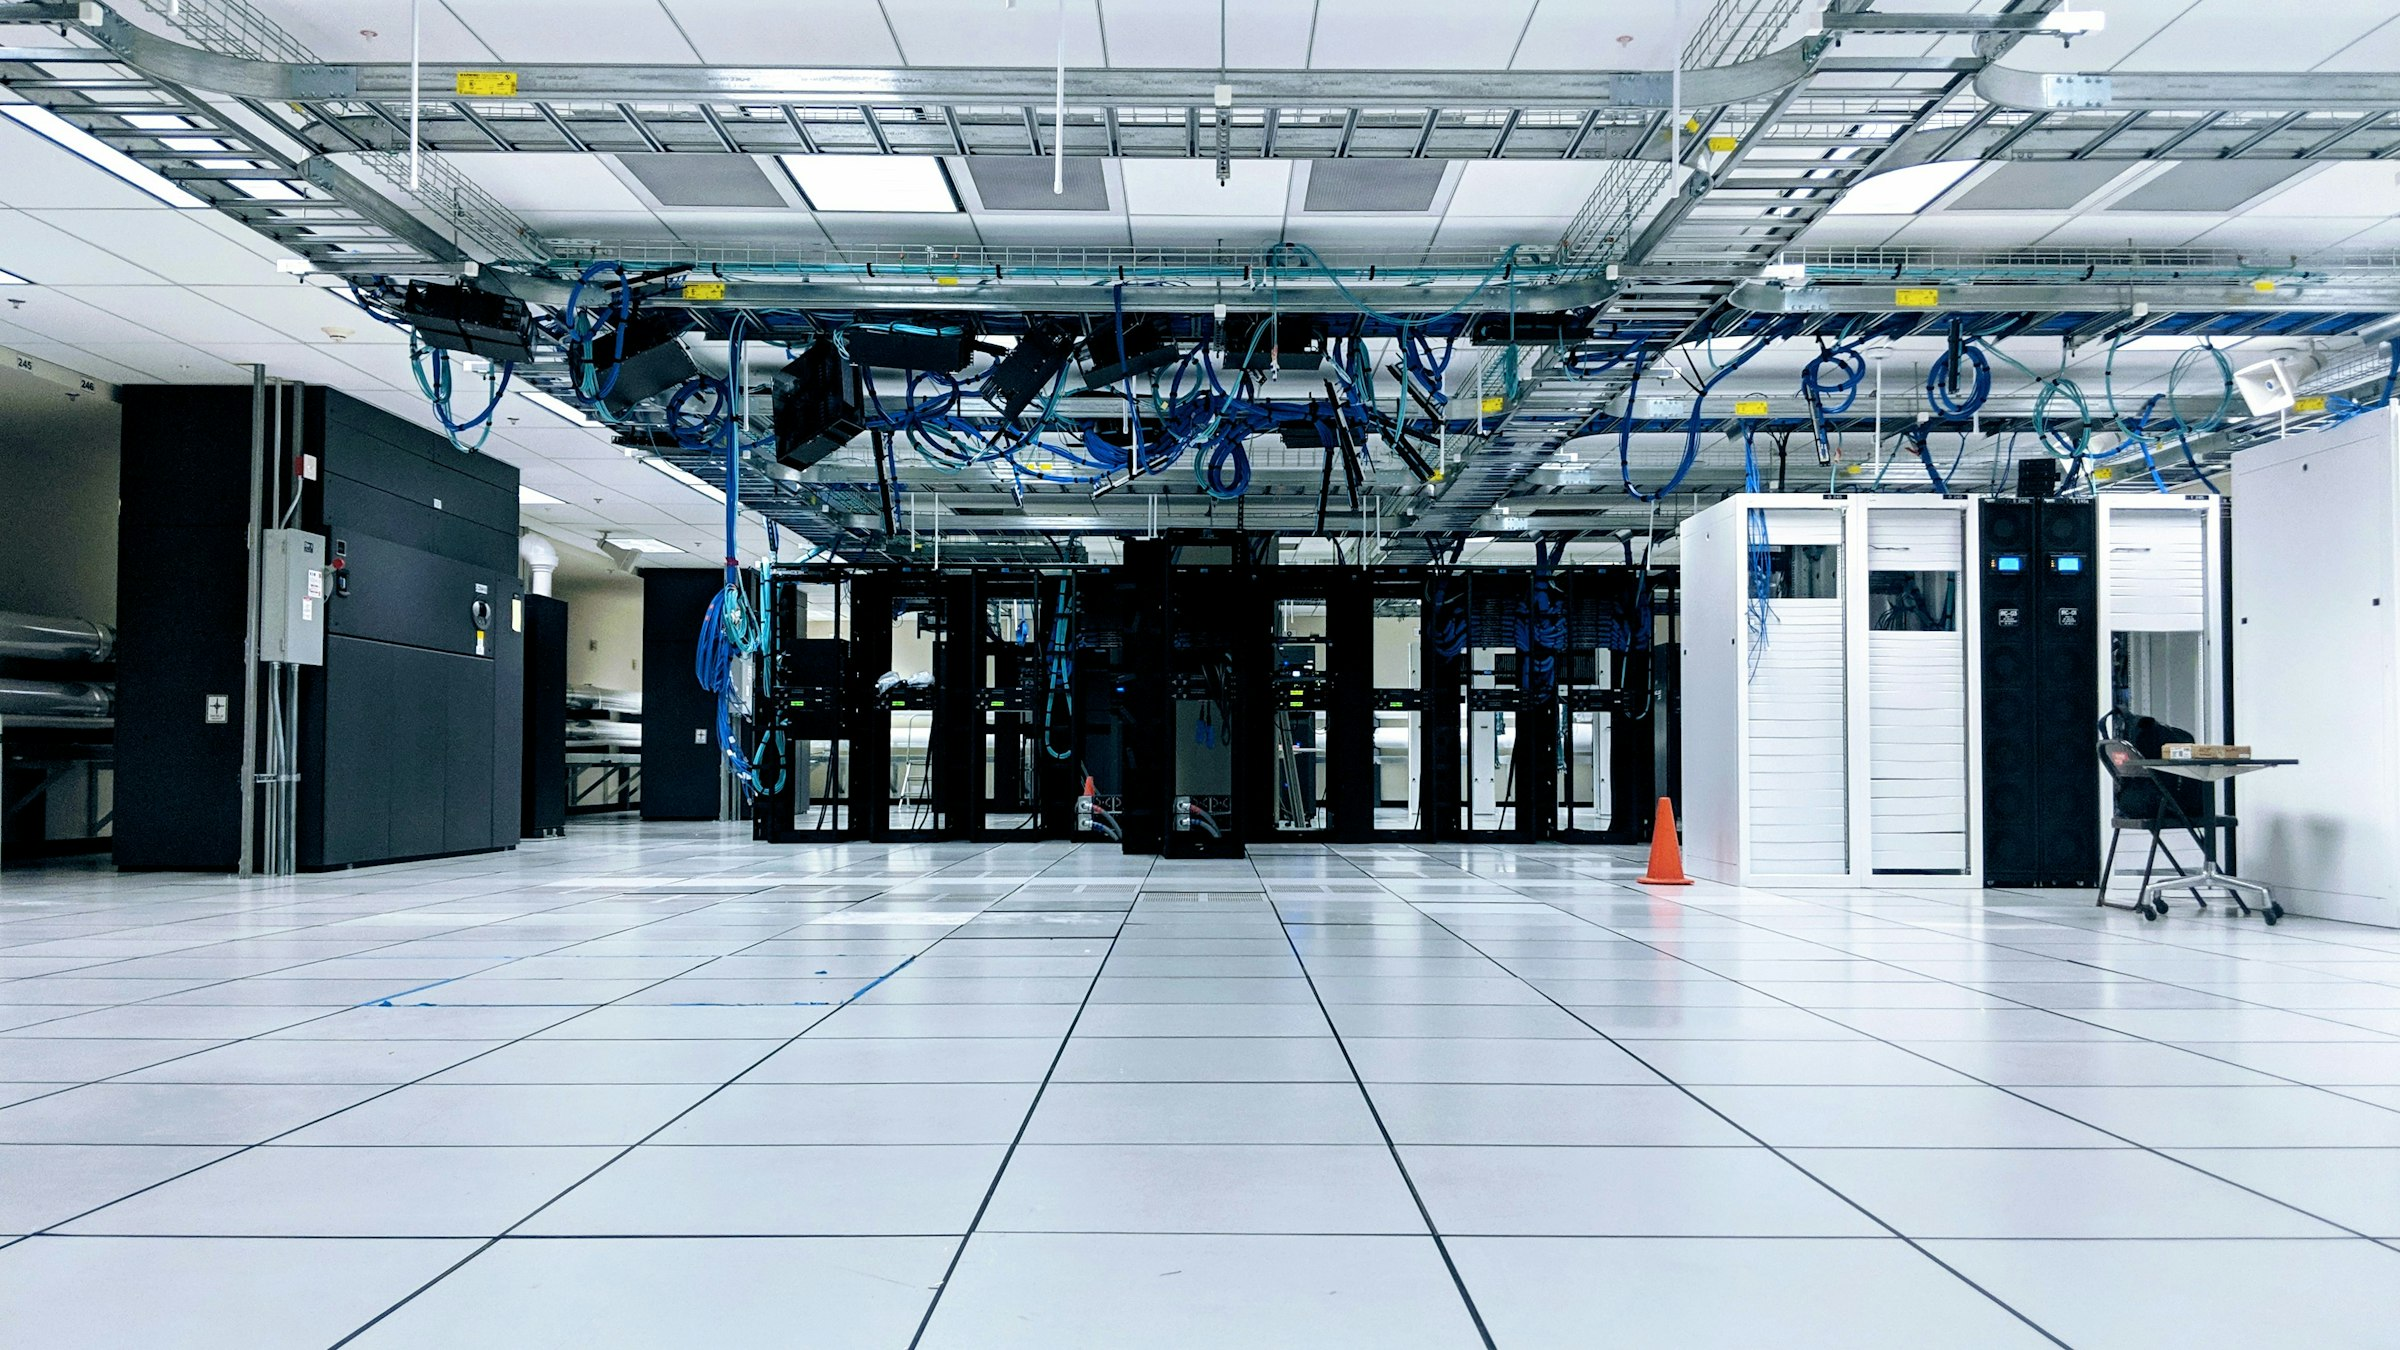
Researchers at Linköping University and the University of Gävle have developed a process-based method for measuring energy use in data centres, using detailed observations of an Ericsson server room to distinguish computing, process cooling and supporting electrical loads.
The university reported the Scientific Reports study on 15 October; it analysed more than 2.6 million data points from an Ericsson room in Linköping, Sweden. Measurements were collected at five-minute intervals across 29 monitoring points over more than ten months in 2021. The resulting classification traces supplied electricity and district cooling through the processes consuming them.
According to the university account, the study reports one year of energy use totalling 4,523MWh, drawing on a measurement campaign lasting more than ten months. Process cooling accounted for 2,154MWh and server operation for 2,135MWh. Together, those two functions represented approximately 95% of the total reported energy use, leaving a relatively small share for pumps, fans, ventilation, lighting and other identified activities.
The study concerns a single room with water-based cooling delivered directly to server rows. It is not a representative survey of European data centres, and the reported distribution should not be applied automatically to facilities using different server densities, climate-control arrangements or energy accounting boundaries.
Measurements expose which systems use energy
The researchers adapted a hierarchical taxonomy that separates processes directly associated with computing from more general room services. The first group includes server operation, process cooling, coolant pumping and fans. Ventilation and lighting are classified as supporting functions.
This approach makes the measurement boundary explicit. Cooling energy may include purchased district cooling or energy consumed by equipment outside the immediate server room, depending on how the system is configured and metered. Treating one site’s cooling figure as interchangeable with another site’s electrical chiller consumption can therefore produce misleading comparisons.
More than 99.9% of the reported energy allocation was attributed to processes directly connected with computing. General ventilation and lighting together represented less than 0.1%, and ventilation alone used approximately 0.9MWh. Those ratios depend on this room’s particular layout, equipment and allocation method.
The methodology also accommodates indirect estimation where direct metering was unavailable. That is useful for filling gaps in an energy balance, but estimates must be distinguished from instrumented readings when performance changes are later assessed.
Process level metrics support operational comparisons
The team developed indicators including energy consumption per square metre, peak power demand, relationships between cooling and electricity use and computing performance per watt. Eleven workshops involving Ericsson staff and consultants helped review which measures could be used to understand changes in the room’s operating performance.
These indicators offer a more granular view than a single site-wide ratio. An aggregate efficiency measure may improve when equipment utilisation changes, even if the underlying cooling plant performs similarly. Breaking the energy balance into processes helps isolate whether a change is driven by IT workload, cooling control, auxiliary equipment or different boundary assumptions.
Process cooling accounted for nearly half the reported energy allocation; interpreting changes in that process requires comparable heat loads, outdoor conditions and cooling service boundaries. A useful comparison would need to account for heat load, outdoor conditions and the cooling service supplied, rather than comparing annual consumption figures in isolation.
Measurement granularity is central to the approach. Five-minute readings can show how loads change during ordinary operation, but interpreting a peak or unusually low measurement still requires attention to sensor accuracy and the time interval used. Equipment that cycles rapidly may have short events that are averaged within a five-minute sample. The study is therefore most useful as a carefully defined energy allocation and monitoring method, not a substitute for every form of electrical or thermal diagnostic testing.
The authors say their taxonomy can be adapted for other data centres where sufficiently detailed measurements are available. Different heat rejection arrangements would require changes to the process definitions and indicators. A direct liquid cooling hall and a predominantly air-cooled enterprise room may be assessed with a similar conceptual method, but not necessarily identical categories or expected results.
The study provides a reproducible way to ask where energy is consumed inside a defined facility boundary. Any claim about sector-wide savings will require further measurements across sites with different cooling systems, workload profiles and climates.

